
Chart AI - Trading AI Analysis
by Indie Mobile Apps (0 Reviews) April 09, 2026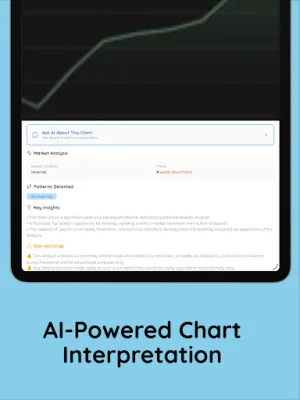

Latest Version
April 09, 2026
Indie Mobile Apps
Finance
Android
0
Free
com.tradingsimple
Report a Problem
More About Chart AI - Trading AI Analysis
Chart AI is an application that allows users to upload screenshots or images of trading charts and receive structured breakdowns in seconds. It is designed for both learners who are developing analysis skills and traders who are seeking educational interpretations, rather than financial advice. The app has several key features, including instant chart interpretation, pattern detection, target zone estimation, support and resistance mapping, a learning journal, market structure overview, and multi-asset compatibility.
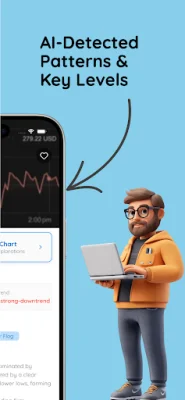
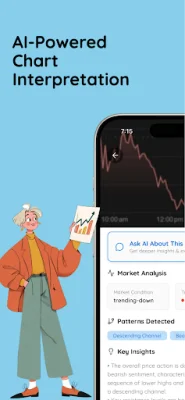
One of the main features of Chart AI is its ability to provide instant chart interpretation. Users can upload screenshots or images of trading charts and receive structured breakdowns in seconds. This allows for quick and easy analysis of market behavior. Additionally, the app automatically highlights common chart structures such as head & shoulders, triangles, flags, wedges, double tops, divergences, and more.
Another useful feature of Chart AI is its target zone estimation. The app uses AI to provide educational estimates of possible price zones based on historical technical patterns. However, it is important to note that these estimates are not predictive or guaranteed. The app also includes support and resistance mapping, which allows users to view likely levels where price historically reacts, consolidates, or changes direction.
Chart AI is suitable for a variety of users, including beginners, students and educators, experienced traders, and swing, crypto, and short-term traders. Beginners can use the app to learn why patterns matter and how analysts interpret charts. Students and educators can use real chart snapshots to study market behavior. Experienced traders can review AI-assisted breakdowns as an educational second opinion. And swing, crypto, and short-term traders can use educational insights to study structure over different timeframes.
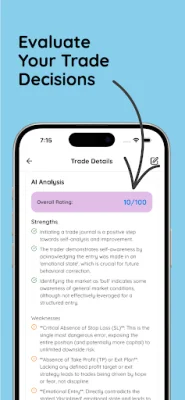
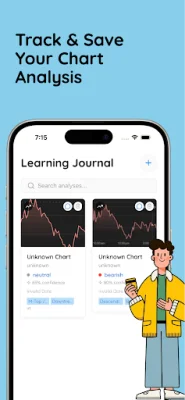
The app works by allowing users to upload a chart screenshot and then receiving an AI-based interpretation. The interpretation includes patterns, levels, zones, and structural readings that are detected automatically. Users can then review contextual insights to understand why patterns are meaningful, how trends work, and how chart structures evolve. The app also includes a learning journal, which allows users to save their chart breakdowns and revisit them later to see how patterns developed over time.
Chart AI is primarily built for educational learning and includes reasoning and explanations for each interpretation. This allows users to learn technical analysis visually and accelerate their improvement in real-world chart reading skills. However, it is important to note that the app does not guarantee market predictions or financial outcomes. It should only be used for educational learning and analysis reference, and users should always verify information independently before making trading decisions. No financial advice is provided through the app.
Rate the App


Popular Apps