Physics Toolbox Magnetometer
2026.03.18 by Vieyra Software (0 Reviews) April 24, 2026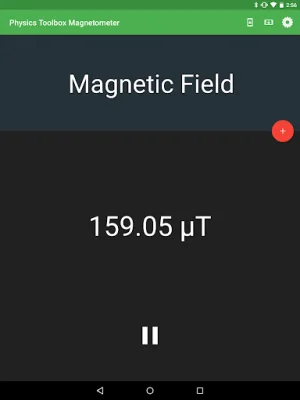
Latest Version
2026.03.18
April 24, 2026
Vieyra Software
Tools
Android
0
Free
com.chrystianvieyra.android.physicstoolboxmagnetometer
Report a Problem
More About Physics Toolbox Magnetometer
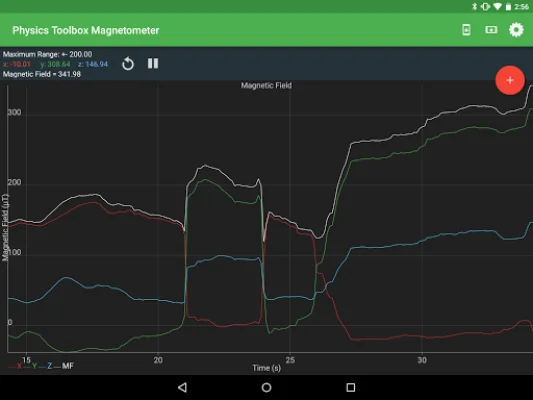
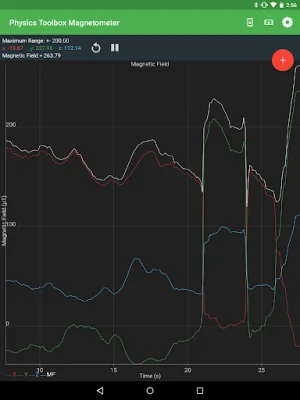
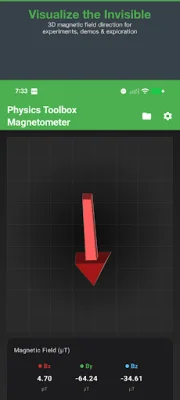
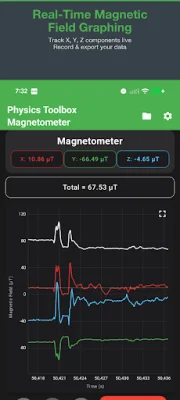
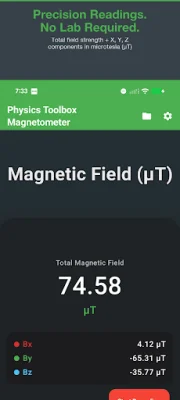
This application offers four powerful view modes for users to visualize and analyze magnetic fields. The first mode, Chart View, displays a live graph of the magnetic field strength over time across different axes and total magnitude. The second mode, Multi Graph, allows users to compare all axes simultaneously in a multi-panel display. The third mode, Digital Readout, provides a clean numerical interface for precise real-time measurements. Lastly, the 3D Compass mode allows users to visualize the direction of the magnetic field in three dimensions.
In addition to these view modes, the application also offers advanced data tools. Users can record and export data as CSV files via email, Google Drive, or any sharing app. The application also includes three signal filters - Kalman, Low Pass, and Moving Average - to help users analyze their data. The sample rate can also be adjusted for slow or fast phenomena, and users can switch between elapsed time and clock time on the x-axis. For a more detailed inspection, there is a fullscreen graph view with customizable plot line thickness.
This application is designed for both classroom and lab use, making it suitable for real scientific investigations. Users can use it to verify the inverse square law for a point source magnet, measure solenoid field strength, detect the frequency of magnetically driven objects, map Earth's background magnetic field, locate hidden permanent magnets or ferromagnetic materials, and demonstrate electromagnetic induction concepts.
Not only is this application useful for scientific purposes, but it also has professional and hobbyist applications. It can be used for EMF detection and field mapping, speaker and motor diagnostics, geomagnetic surveys and field work, and metal and magnet proximity sensing. With its versatile features and capabilities, this application is a valuable tool for anyone interested in studying and understanding magnetic fields.
Rate the App


Popular Apps