
Stock Analysis: Stocks & Funds
1.1.15 by StockAnalysis (0 Reviews) March 19, 2026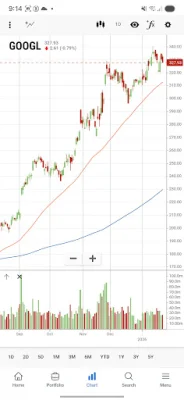
Latest Version
1.1.15
March 19, 2026
StockAnalysis
Finance
Android
0
Free
com.stockanalysis.app
Report a Problem
More About Stock Analysis: Stocks & Funds
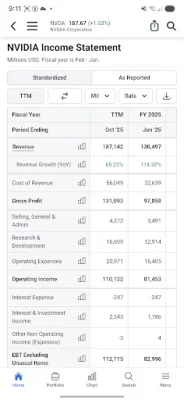
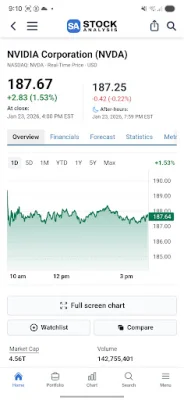
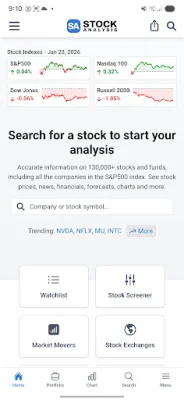
The Stock Analysis app provides comprehensive coverage of the global stock market, with data on over 130,000 stocks and funds from all countries and exchanges. This includes real-time updates, including pre-market and after-hours quotes, as well as basic and advanced technical analysis charts. The app can be easily installed and used without the need for an account.
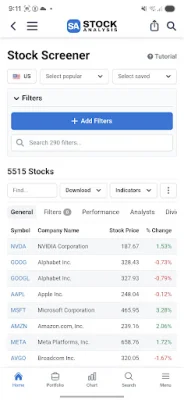
With real-time stock prices and news, the watchlist and portfolio tracker allows users to create custom views with over 200 unique indicators to easily monitor their investments in one place. The app also offers a stock and ETF screener with over 290 filters and indicators to help users find their next investment opportunity.
The data provided by the app is accurate and of enterprise-grade quality, sourced from reputable providers such as S&P Global. This allows users to access the same level of data used by professionals and institutions. The app also offers a variety of charts, including basic stock price and financial charts, as well as advanced charts with over 100 technical analysis studies.
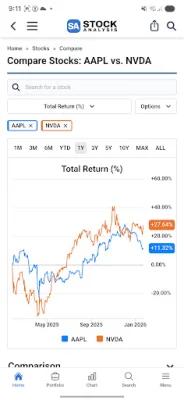
In addition to these features, the app also offers detailed financial and dividend histories, analyst price targets and ratings, and support for both light and dark mode. Users can also compare stocks and ETFs, view the top gainers and losers of each trading day, and see the top trending stocks. The app also includes an IPO calendar and historical IPO data, as well as information on corporate actions and ETF holdings.
Rate the App


Popular Apps