
TheThingV ThingSpeak/InfluxDB
by MGL CodeLabs (0 Reviews) July 11, 2026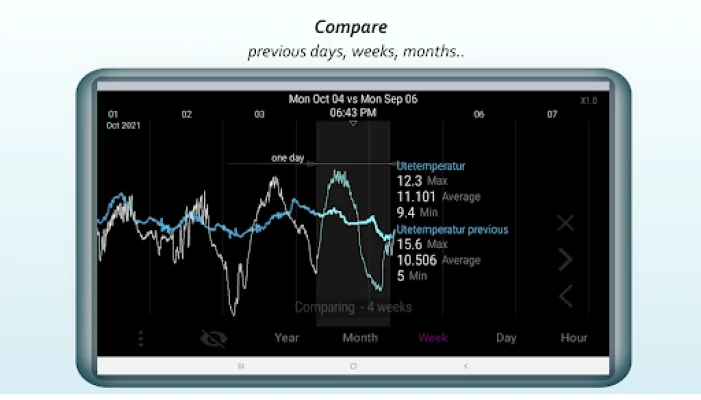
Latest Version
July 11, 2026
MGL CodeLabs
Tools
Android
0
Free
com.mlundell.theThingV
Report a Problem
More About TheThingV ThingSpeak/InfluxDB
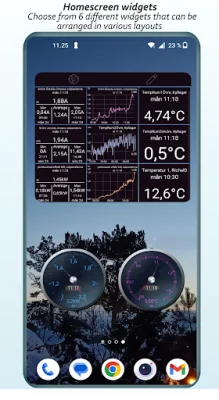
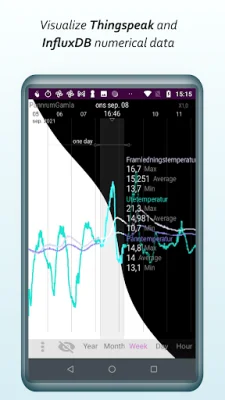
Data can be easily visualized in both the app and on the homescreen through widgets, such as dashboards. This is made possible through ThingSpeak™, an open source IoT platform that allows for the storage and retrieval of data from various sources using HTTP over the internet. For more information, users can visit the website at https://thingspeak.com. Additionally, Influxdb, a timeseries database, is also supported by the app. However, it is important to note that only versions 2.XX of InfluxDB are currently supported, with older versions not being compatible.
With ThingSpeak™ or InfluxDB, users have the ability to create their own DIY sensor logging applications and monitor various things, such as a greenhouse or weather station. TheThingV, the app in question, makes it quick and easy to view both recent and historical data from ThingSpeak™. It also offers support for InfluxDB, allowing for the mixing of fields from both platforms in the same channel. The app is capable of handling large amounts of data, with smooth scrolling thanks to hardware accelerated graphics. However, the amount of available memory may limit this capability.
TheThingV stores downloaded data, providing instant access to historical data upon starting the app. Recent data is also automatically added and saved while the app is in use. While ThingSpeak™ has a maximum data limit of 8000 rows, TheThingV seamlessly adds 8000 row chunks until the desired timespan is filled. The app also offers the ability to display single or multiple graphs in the same view, with the option to choose different Y-scales for fields with large differences in values. Users can also manually set minimum and maximum values for the Y-scales, as well as customize their names.
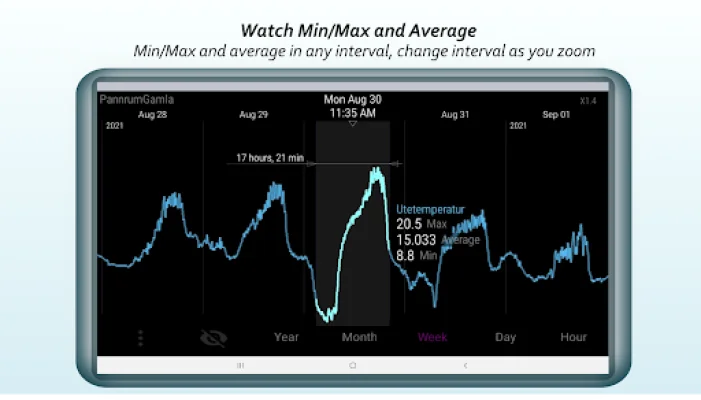
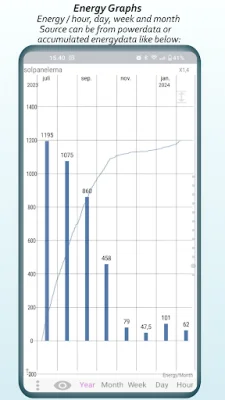
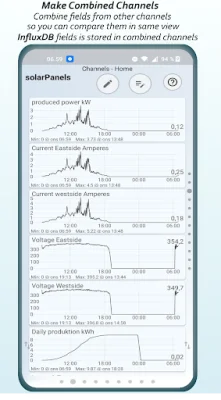
The app offers a variety of features, including the ability to view multiple graphs in the same view with different Y-scales, view fields from both ThingSpeak™ and InfluxDB in the same view, and view values or min/max and average in any interval. Users can also compare hours, days, weeks, and months for single or multiple fields, create combined channels, and choose between linear, nonlinear, and logarithmic scales. The app also offers the option to convert power graphs to energy, has no 8000 row limit, and allows for the choice between 12 or 24 hour format. Additionally, users can customize the background and graph colors, choose between a linear X-axis or "wheel", and for paid users, export and import settings and data.
Rate the App














Popular Apps