

G-NetView Pro
by GyokovSolutions (0 Reviews) March 20, 2026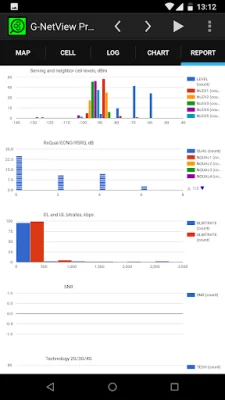
Latest Version
March 20, 2026
GyokovSolutions
Tools
Android
0
$34.99
com.gyokovsolutions.gnetviewpro
Report a Problem
More About G-NetView Pro
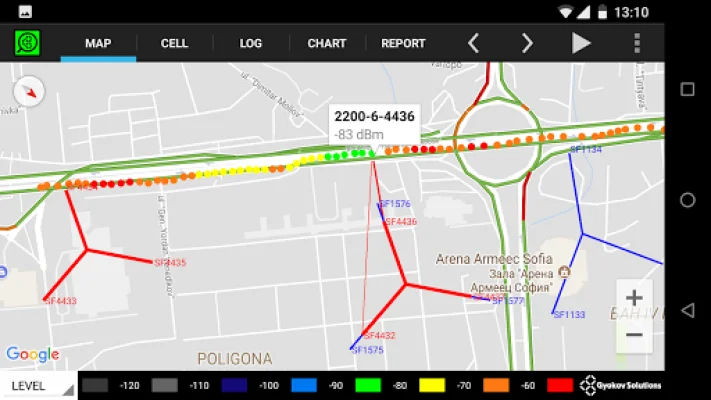
This is an application that allows for one-time payments without any monthly fees. It offers various features such as visualizing logfile points on a map, displaying serving and neighbor cell lines, and providing different thematic maps for various measurements. These measurements include LEVEL, QUAL, CELL, TECH, PCI/PSC/BSIC, SNR, BITRATE, SPEED, ALTITUDE, SERVING DISTANCE, SERVING BEARING, SERVING ANTENNA HEIGHT, ARFCN, TEST PING, TEST BITRATES, NEIGHBORS LEVEL, and NEIGHBORS QUAL. The app also provides information on measurement points, charts, and histogram statistics. Users can export these charts and statistics in HTML format to view on a desktop browser. Additionally, the app has a logfile player and allows for floorplan loading for indoor measurements.
It is important to note that in order to visualize serving and neighbor cells, users must load a cellfile with cell locations. The app cannot guess these locations automatically.
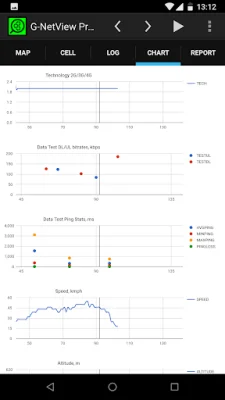
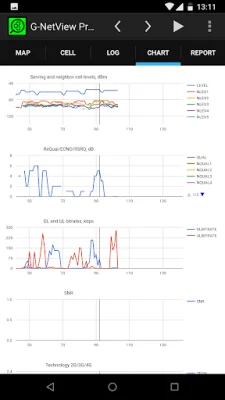
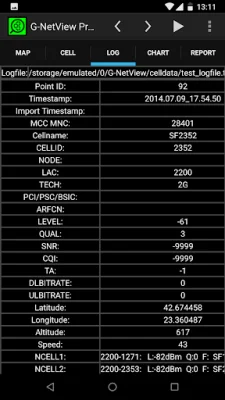
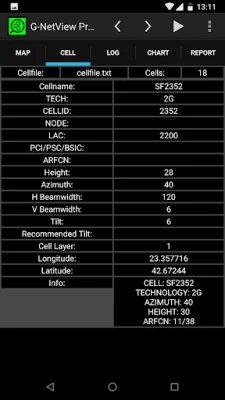
To use the app, users must first load site data from the cellfile.txt in the G-NetView/celldata folder. They can also use a sample cellfile provided upon installation. Next, they can load a text logfile by selecting it from the G-NetView/celldata folder or using the sample test_logfile.txt. Users can then use buttons to play the logfile or select a point to view measurements. The LOG tab displays measurements for the selected point, the CELL tab provides information on serving or manually selected cells, and the CHART tab displays measurement charts that can be moved or zoomed using buttons. The REPORT tab shows measurement statistics charts.
In summary, this application is a one-time payment app with no monthly fees. It offers various features for visualizing and analyzing measurements, and allows for easy exporting of charts and statistics. Users must load a cellfile for accurate visualization of serving and neighbor cells, and can easily navigate through the app using buttons and tabs.
Rate the App


Popular Apps