

BLE Analyser
1.3 by keuwlsoft (0 Reviews) October 21, 2024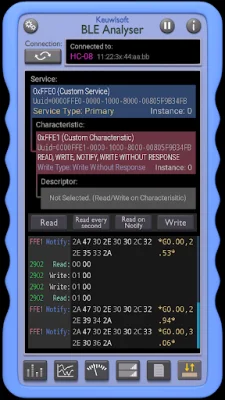


Latest Version
1.3
October 21, 2024
keuwlsoft
Tools
Android
0
Free
com.keuwl.ble
Report a Problem
More About BLE Analyser
This application offers six different modes for users to choose from: Levels, Graph, Meter, List, Report, and Read/Write. Each mode provides a unique way to view and interact with the data being collected.
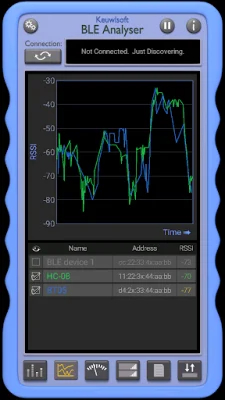
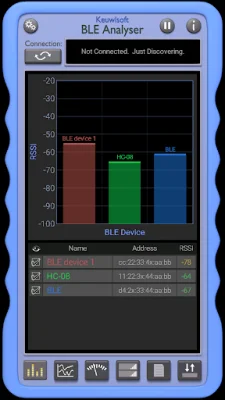
In the Levels mode, users can view the received signal strength indicator (RSSI) on a scale, allowing them to easily see the strength of the Bluetooth Low Energy (BLE) signal. The Graph mode offers a visual representation of the RSSI over time, allowing users to track any fluctuations or patterns. The Meter mode displays the RSSI as a gauge, providing a quick and easy way to see the current signal strength.
For those who prefer a more detailed view, the List mode displays the RSSI in a list format, showing the average, maximum, and minimum values. This mode also allows for auto-scaling or touch scaling/panning of the graph, giving users more control over how they view the data.
In addition to viewing the RSSI, this app also allows users to write data to characteristics or descriptors in ASCII, hexadecimal, 32-bit integers, or floats. This feature is useful for those who need to send specific data to their BLE devices.
It's important to note that this app is specifically designed for BLE devices and will not work with Bluetooth Classic devices. This ensures that users are getting the most accurate and reliable data for their BLE devices. With its various modes and data writing capabilities, this app is a valuable tool for anyone working with BLE technology.
Rate the App


Popular Apps