
Spectroid
1.1.2 by Carl Reinke (0 Reviews) September 03, 2024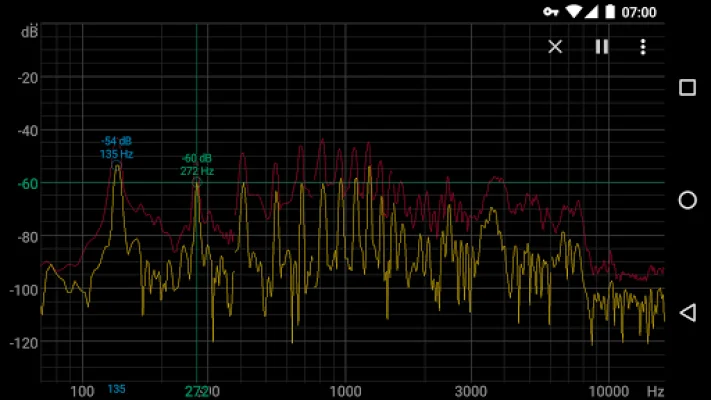
Latest Version
1.1.2
September 03, 2024
Carl Reinke
Tools
Android
0
Free
org.intoorbit.spectrum
Report a Problem
More About Spectroid
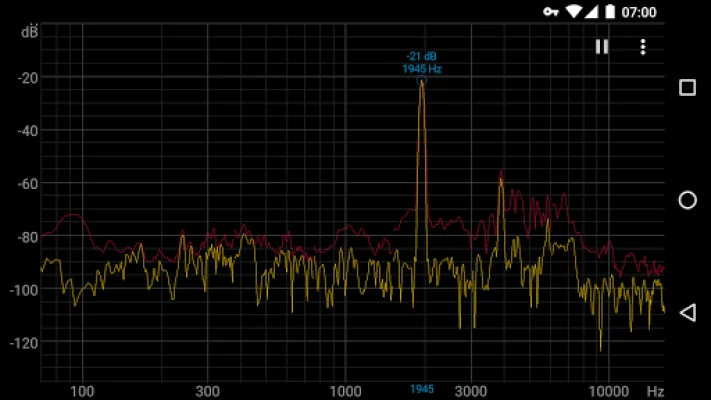
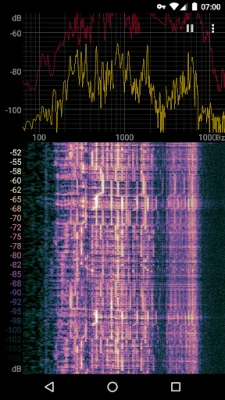
Spectroid is a mobile application that allows users to visualize and analyze audio signals in real-time. It uses a technique called Fast Fourier Transform (FFT) to convert the audio signal into a frequency spectrum, which is then displayed on a graph. The app also includes a waterfall plot, which shows how the frequency spectrum changes over time.
One of the most frequently asked questions about Spectroid is why the decibel (dB) values shown on the graph are negative. This is because the app uses dBFS (Full Scale) as its reference point, where 0 dB represents the maximum power that the microphone can measure. Therefore, any measured power that is less than the maximum will result in a negative dB value.
Another common question is whether users can zoom in on the spectrum plot. The answer is yes, as the app supports a two-finger pinch-to-zoom gesture. This allows users to focus on specific parts of the spectrum and analyze them in more detail.
Some users may notice discontinuities or gaps in the spectrum plot and waterfall. This is due to Spectroid using multiple FFTs overlapped in frequency to provide better frequency resolution at lower frequencies. While this method may result in minor discontinuities, it allows for a more accurate representation of the audio signal and matches the frequency resolution of human audio perception.
Lastly, some users may wonder if they can export the spectrum data from the app. However, Spectroid is not intended to be a calibrated instrument and should not be used as such. If users require accurate spectrum data, it is recommended to use an actual spectrum analyzer rather than a mobile app. Spectroid is designed for casual use and to provide a general understanding of audio signals and their frequency components.
Rate the App


Popular Apps